
According to IATA’s 2050 Vision Report, in the past 40 years the volume of air travel has expanded tenfold and air freight has grown by a factor of fourteen. The world’s economies have grown three to four times over the same period. Air transport has been one of the world’s fastest growing economic sectors.
Consolidation in the US Airline Industry over recent years has been prolific and has resulted in four airlines (Delta, American Airlines, Southwest and United) controlling approximately 80% of the domestic US air travel market.

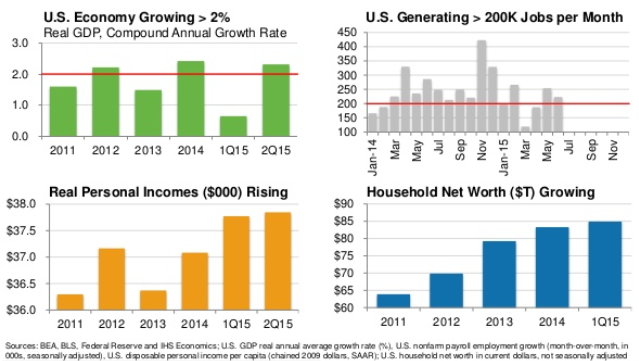
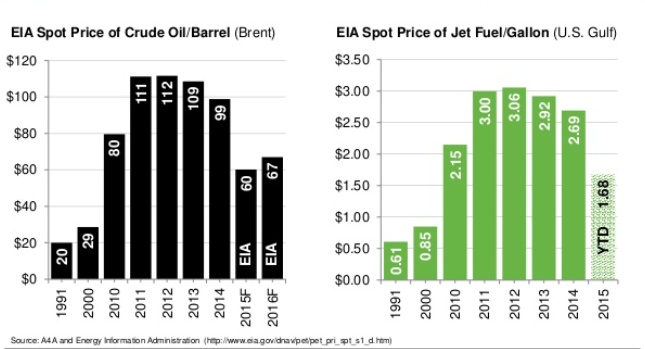
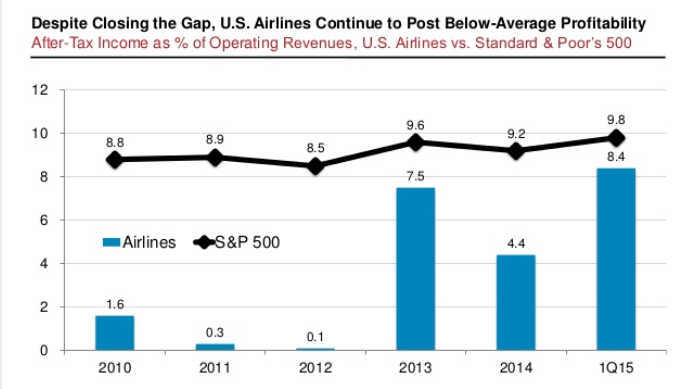
According to a review by Airlines For America, an expanding US economy, employment growth rising personal incomes and the highest U.S consumer sentiment in over a decade is driving increased demand for air travel. Strong demand has supported a more rational approach to pricing. A stronger US dollar and falling fuel and oil prices have also supported further margin growth and overall profitability.
Source: Standard and Poors and A4A Passenger Airline Cost Index & Company Sec filings
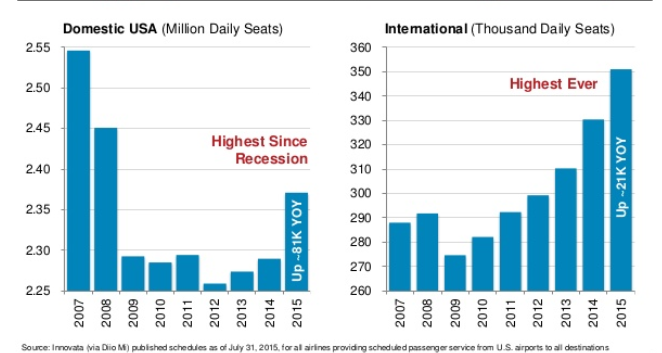
On average, as at 30th June 2015, US airlines have increased domestic capacity by 5.5% Year on Year, offering domestic travellers the most seats in seven years and the most seats ever for international travel.
In this context, management teams are focused on paying down debt and on maximising shareholder returns. Over the last ten years (to December 2014) IATA and the International Civil Aviation Organisation (ICAO) have shown Return on Invested Capital for system-wide global commercial airlines to have increased from 2.9% in 2004 to a forecasted 7.5% for the 2015 Calendar Year. North American airlines are expected to generate more than half of the industry’s yearly profit. Along with a focus on maximising shareholder returns, Airlines for America recently reported that outlays on capital spending exceeded US$1.1Bn per month over the course of the 2014 Calendar Year and, thus far, US$1.4Bn per month for 2015. Most of this expenditure has been in the form of new fleet as well as upgrades to existing fleet, expanding route networks, improved check in areas, lounges, gates, baggage systems and ground equipment. Airlines are also focused on ‘giving back’ to their customers, with the average yield on fares falling by 5.5% YOY to June 2015.
Disclaimer
We are pleased to share our investment insights with you. This information is general only and does not take into consideration the investment objectives, financial situation or particular needs of any reader. Information contained herein may not be appropriate for your personal situation and we encourage you to consult a financial advisor before making any investment decision.
Join our investment community. Be the first to receive NAOS News, Insights and Invitations.